I found myself in the position that is familiar to many developers. I have too many projects that I want to implement and not enough time. Do I spend my time learning microcontroller programming or building a tool to generate cross stitch patterns? For a brief moment, I considered reviving my project management app from years ago, before realizing that this was yet another project.
One of the great things about being able to write software applications is that you can create software customized to your specific needs. However, this comes with the curse of being able to come up with dozens of ideas for projects that would be slightly better than the ones that are broadly available. For example, I want a music app that integrates with RSS so I can listen to podcasts in the same place, even if they came from a private Patreon feed.
With a large volume of potential projects to spend my programming time, comes a difficulty in bringing any of them to completion. There is always another interesting technical challenge to approach on the next project that is more fun than the work it takes to fix the edge cases and implement necessary functionality. Plus, my time outside of work is limited and shared with other, non-technical pursuits. This isn't to say that there is no value in working on projects without shipping a finished application. I've learned most of what I know about a number of technical topics from projects that I set aside in an incomplete state over the years.
So what's a good solution?
If building a project management tool is Yet Another Project, what are alternative options? There is always something like Trello, which uses a Kanban board approach to managing tasks. However, I have found this to be less useful for teams of size 1, because the big benefit of Kanban is that it helps organize a sequence of stages of work so that everyone knows what they need to do and what is going to end up on their plate soon. With just myself, there is no hand-off required for each column of the board. There are GitHub issues, but those are spread across repositories and so it is challenging to stay organized. I only remember to check my GitHub issues when I'm already thinking of that specific project.
I decided to go with a paper and pencil approach for now. This has the advantage of being low-effort compared to more technical solutions. There is neither a deployment process nor rabbit holes to investigate (a proper application intended to be deployed in my local network totally needs an authentication solution, script injection protection, and other features where an exceptional amount of time could be spent).
For the organizational technique, I decided to use a burn down graph. For those unfamiliar with burn down graphs, the involve estimating a number of tasks and a deadline. The X-axis represents days from now till the deadline and the Y-axis represents estimation points. A line is drawn from the start day at the number of estimated points to the end day at zero. As the days progress, you record the number of remaining points for that day and connect the day's position to the position of the previous day. This progress line can be compared to the "ideal" progress line to see if you are ahead of schedule or behind schedule.
Strengths of Burn Down Graphs
For personal projects, deadlines are entirely arbitrary. The value of a burn down graph is that it visualizes progress as a motivational tool. If you are following a version of SMART goals, burn down charts help with the "measurable", "achievable", and "time-bound" aspects of goal-setting. It doesn't help with the "specific" and "relevant" aspects, but doing those steps well helps the overall process (e.g. tasks that are less specific can require more time and therefore take longer to mark them complete on the burn down chart).
The burn down technique has a very low amount of effort required for the value I get out of it. By following a simple feedback loop of estimate, do, observe, and repeat, I can get an accurate understanding of how much work I can accomplish in a week. This allows me to set my personal expectations so that I'm not disappointed when I don't accomplish everything in a single week. The observation step is especially important, because it allows me to reflect and realize when I am attempting to do too much work on projects and if my mind needs time to relax instead. I can also tailor this on a weekly basis, so I can prepare a lighter plan if I know my work week is going to be particularly hectic.
Limits of Burn Down Graphs
It is important to realize that burn down charts are not the best tool for every job. In particular, they expect the number of tasks to always be decreasing. This does not work well for projects that add tasks in the middle of the time-frame. Cumulative flow diagrams are a popular tool for Kanban projects that can handle work entering at any time. Instead of focusing on a specific deadline that the team is attempting to meet, these diagrams focus on the efficiency of different stages of the process to make sure that there aren't specific parts of the process that are blocked or backed-up.
Another limitation of burn down charts is that the X-axis is divided by days. If a task takes longer than a day, the progress doesn't get spread out over the whole time that the work was done. This is fine for tasks that absolutely must be done by a deadline. If tasks can roll over from week to week, the effort doesn't appear in the previous week's graph. The generally accepted solution to this is to create smaller tasks, but sometimes the smallest measurable task might be too big to be accomplished in a single evening.
Remarkable Template
I use the reMarkable tablet tablet for note taking and organization. This allows me to replace carrying around several notebooks in favor of a single device for work and personal organization. I wanted to create a custom template for this purpose, so I followed the directions on the Remarkable wiki. I set it up so the top portion allows me to list out the tasks for the week and record their estimated effort. Once I complete them, I record a more accurate number of points. The section below contains the burn down graph, with the X-axis labeled with the days of the week. The Y-axis is left with blank space for manual labeling based on the total number of estimated points in the week.
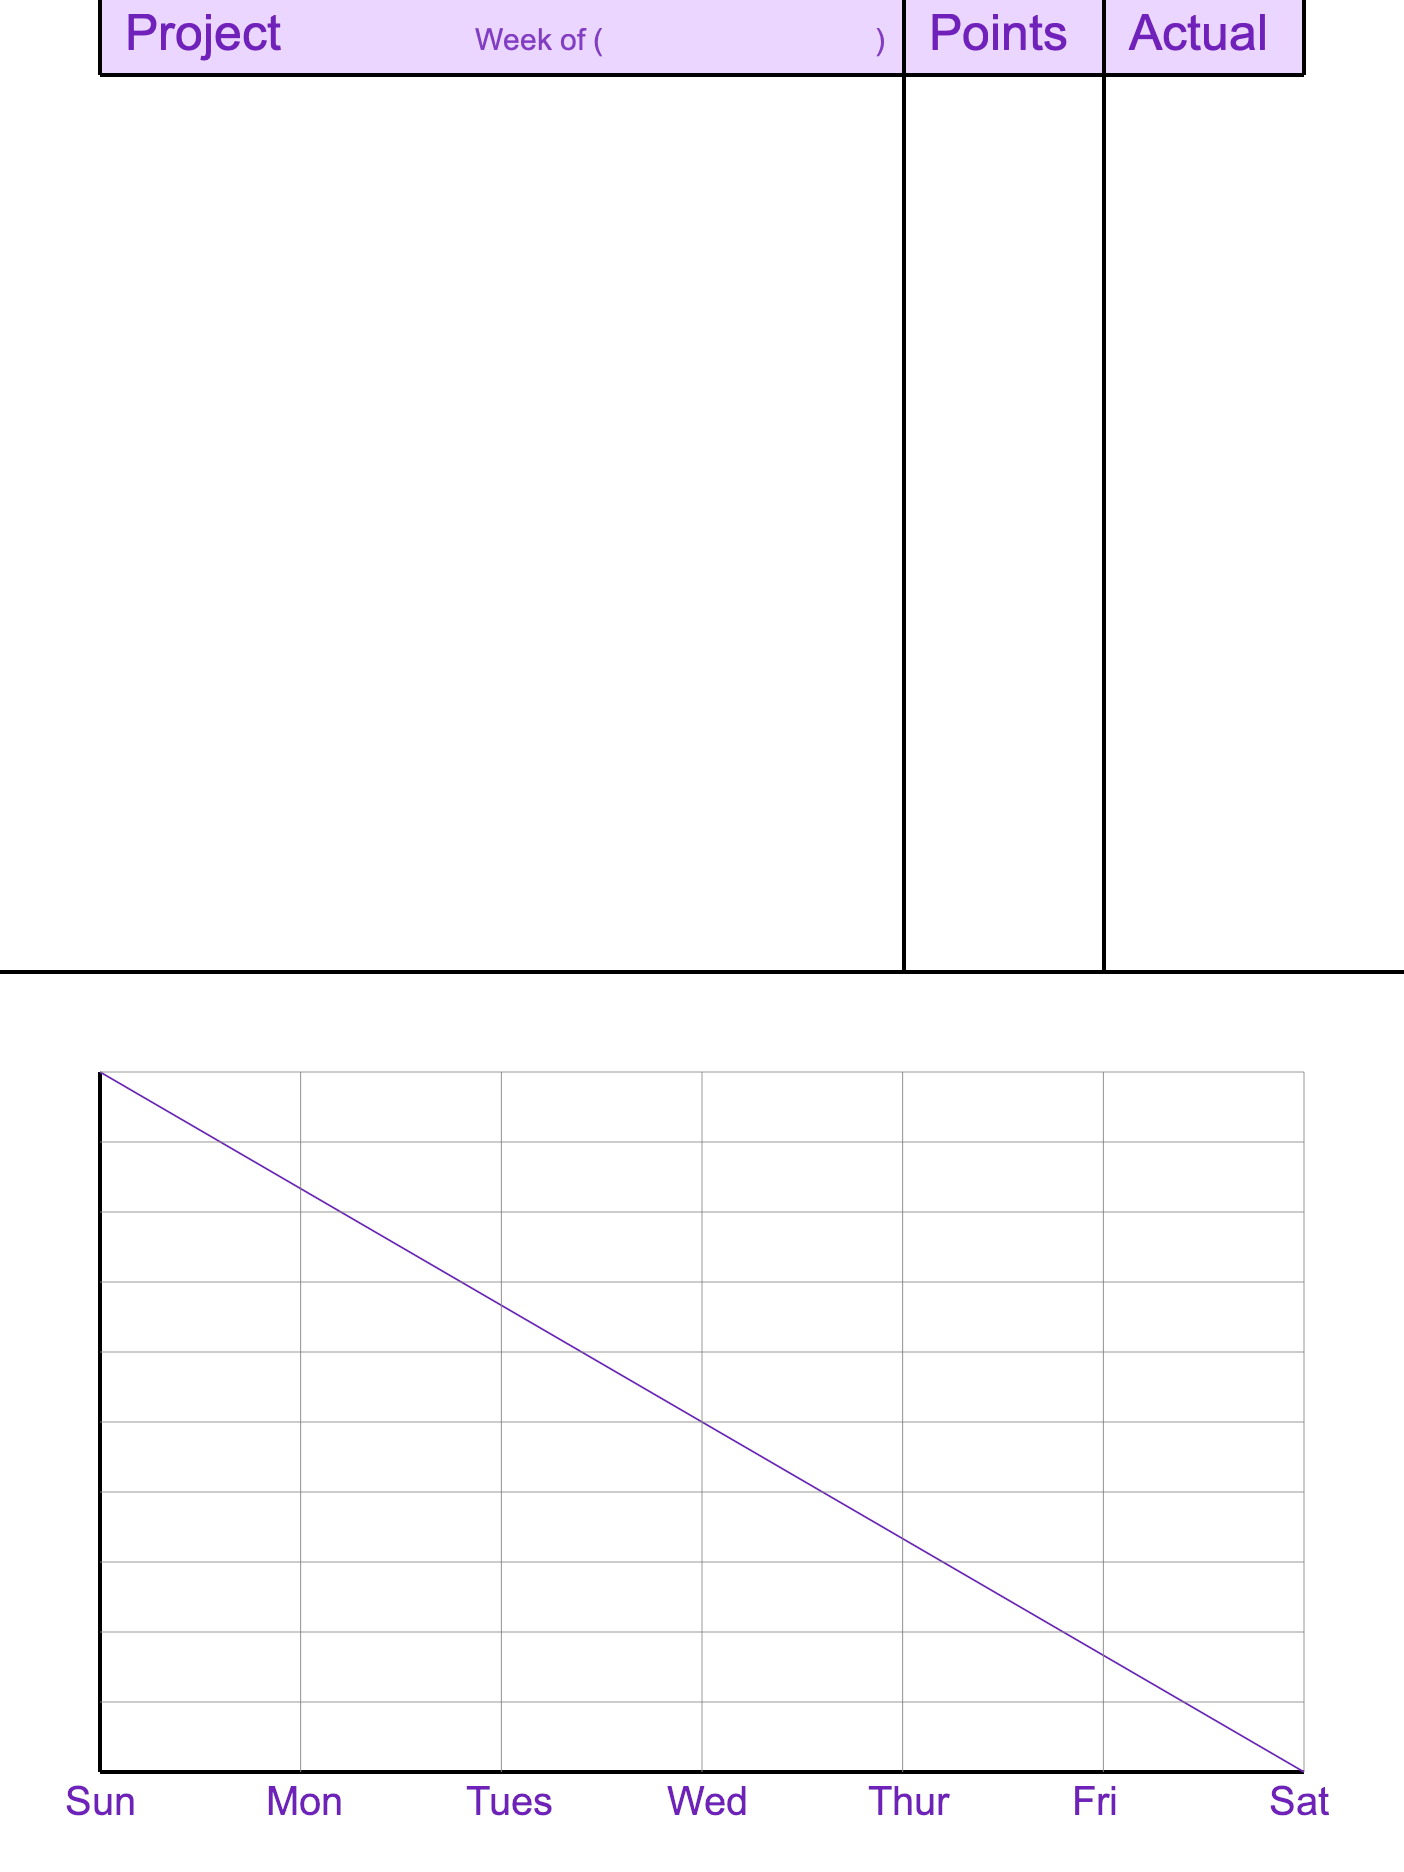
The burn down template as an SVG file